How recalibrated figures and raw production data challenge official PPP estimates
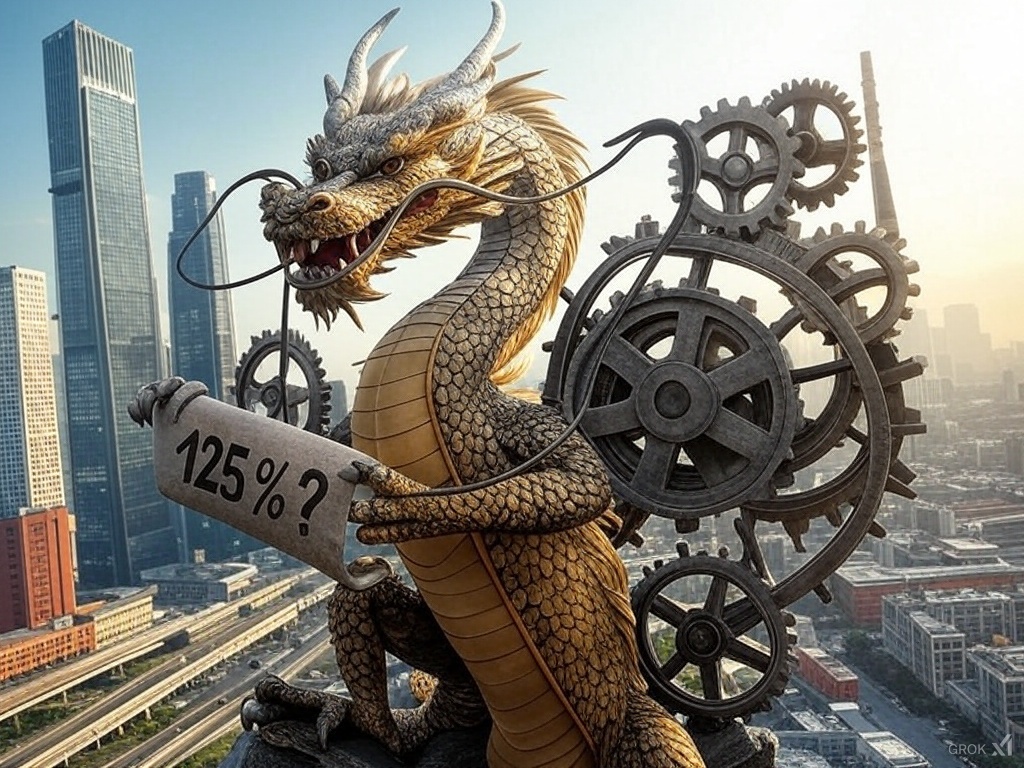
In a world where every percentage point counts, one must ask: Is China’s economy truly only 125% of the U.S. when raw data hints at a far grander reality? The latest International Comparison Program (ICP) survey by the World Bank—despite its impressive data-gathering feat of visiting 16,000 shops in China—reports that China’s purchasing power parity (PPP) GDP, based on 2021 pricing, nudged upward from 119% to 125% of the U.S. figure. Yet beneath these seemingly modest adjustments lies a debate as fierce as any global economic rivalry.
Data vs. Daily Realities: The Numbers That Defy Expectations
At first glance, a 5.6% increase in China’s relative economic size may seem noteworthy. However, a closer look at the production and consumption landscape tells a different story. China’s manufacturing might—producing twice as much electricity as the U.S., 12.6 times the steel, and 22 times the cement—paints a picture of an economic behemoth. This is reinforced by its unparalleled prowess in industries like shipbuilding, where Chinese shipyards now dominate more than 50% of global output. Furthermore, the consumer market surges ahead with figures that include 26 million vehicles sold and 434 million smartphones purchased in a single year—volumes that far outstrip U.S. metrics.
Political Implications: A Calculated Narrative
Why then do official numbers remain so conservative? Critics argue that China’s National Bureau of Statistics (NBS) has long adhered to a Material Product System (MPS) that purposefully underplays the value of services—a sector that Western economies now measure expansively. By design, China’s historical accounting practices have kept its GDP figures modest, a stance that once secured pivotal WTO concessions and now helps maintain its “developing economy” status. This political positioning not only influences global economic narratives but also complicates comparisons with nations that have embraced a broader Service National Accounts (SNA) approach.
Economic Outlook: Beyond the Surface of GDP Figures
When comparing tangible outputs, the discrepancy grows even starker. In 2023, China’s auto market alone, with domestic brands offering vehicles at dramatically lower prices while rolling out advanced plug-in hybrid models, highlights a dual strategy of volume and innovation. Technology sectors, too, have seen an unprecedented drop in costs—from solar panels to lithium-ion batteries—indicating fierce domestic competition that pushes quality upward even as prices plummet. Yet, the ICP survey, conducted over four years ago, fails to capture these rapid shifts, suggesting that an accurate recalibration of China’s economy might demand a gross-up of 25–40% over the current figures.
Quick Insights
- China’s official PPP GDP is pegged at 125% of the U.S., yet raw production metrics suggest a much larger scale.
- Massive outputs in steel, cement, and consumer electronics hint at an economy underestimated by traditional surveys.
- The NBS’s adherence to an outdated MPS framework for services measurement may deliberately understate economic size.
- Political and strategic considerations have historically influenced how China reports its economic data.
- Future revisions could realign global comparisons, challenging conventional economic hierarchies.
What’s Next?
As global dynamics evolve, so too must our methods of measurement. Will an updated survey framework finally capture the explosive growth in China’s services and technology sectors? Analysts speculate that as methodologies modernize—integrating real-time pricing data and broader service metrics—the recalibrated figures might finally reflect the full magnitude of China’s economic engine. This evolution could not only reshape international economic comparisons but also redefine the competitive landscape between BRICS nations and established Western powers.


